 Cookie preferences
Advertising Analysis: How to understand if your ads are doing well


4. Write an Ad Analysis Report Step by Step (Copyable Framework)
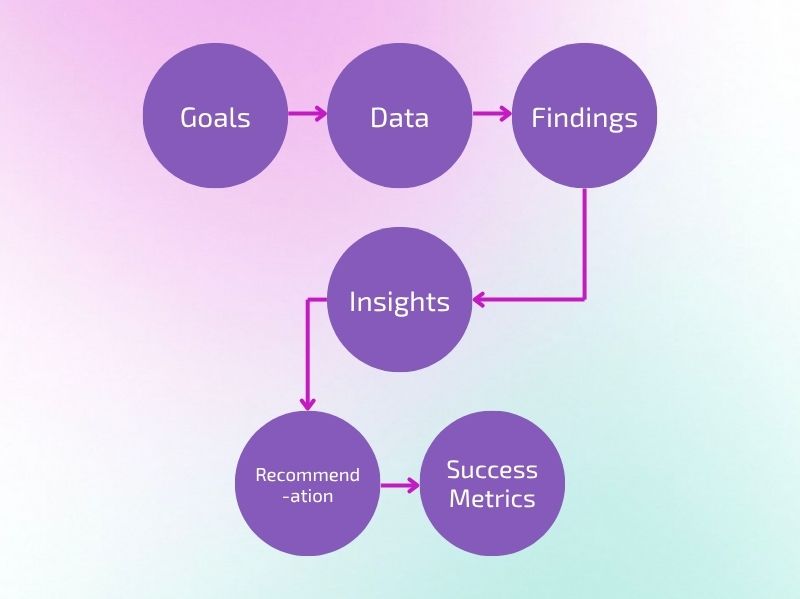
Following best practices, your report should cover six parts: Goals, Data, Findings, Insights, Recommendations, and Success Metrics. Here’s a plug-and-play outline:
- Goals: What are we trying to achieve this round? (e.g., 30% more trial bookings, increased brand reach, more website inquiries.)
- Data summary: spend, impressions, CTR, conversion rate, CPA, ROAS (broken down by platform/audience/creative).
- Key findings: which audience/keywords/placements performed best? Which landing page shows the highest drop-off?
Insights: explain the “why” behind the numbers. For example:
The ad image is too busy, so the main point isn’t clear.
The message is too generic, so the audience doesn’t connect.
The landing page doesn’t match the ad promise, causing drop-offs.
- Recommendations:
- Search: add negative keywords, improve relevance, prioritize high-ROAS terms.
- Social: replace low-engagement creatives; move high-engagement audiences into conversion creatives.
- Website: align above-the-fold with the ad promise, speed up pages, shorten forms.
- Success metrics: Finally, set concrete targets for the next cycle—for example, reduce cost per inquiry by 15% next week, and drive more completed bookings or purchases next month.
6. Analyzing Ads: Three Case Studies to Understand the Strategy Behind the Ads
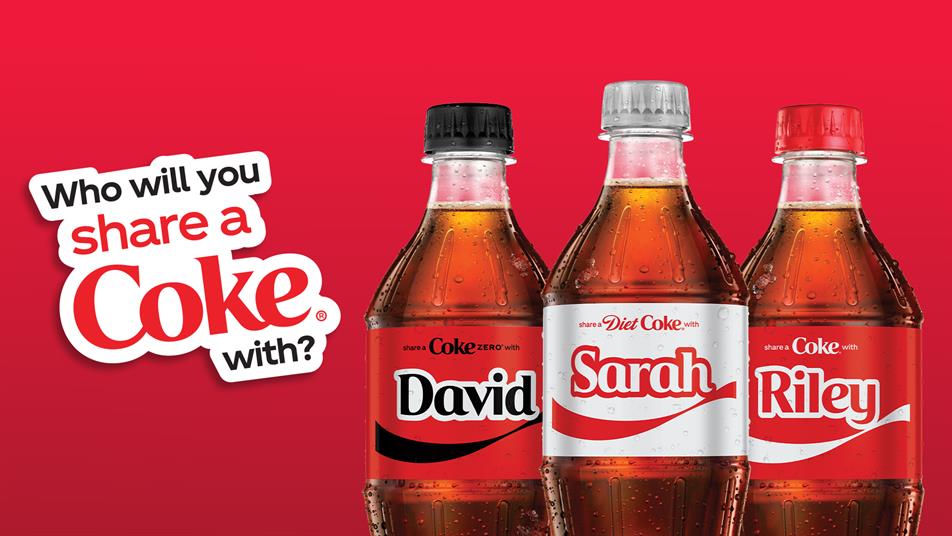
Example 1: Coca-Cola “Share a Coke”
Audience (Who?)
Targeted mainly at young people and active social media users who enjoy interaction and self-expression.
Message (What?)
Coca-Cola replaced its logo with popular first names, encouraging people to “share a Coke with” someone. The focus was on human connection, not product features.
Results (Impact)
- In the 2014 U.S. campaign season, carbonated drink sales rose by over 2%.
- The campaign was rolled out in more than 80 countries in its first few years.
- The 2025 relaunch version is expected to reach over 120 countries worldwide.
Also read: Best Coca-Cola Adverts
Example 2: Nike “You Can’t Stop Us”
Audience (Who?)
The target group includes sports enthusiasts who value perseverance and inclusivity, regardless of nationality or gender. Nike sought to showcase the universal power of sport by connecting different athletes and moments.
Message (What?)
The video uses split-screen editing to connect footage from various sports, emphasizing the message: “No matter what happens, we move forward.” The focus wasn’t on selling products—it was about storytelling, resilience, and unity.
Results (Impact)
- The video has accumulated over 58 million views since launch.
- The campaign generated an estimated US$8.95 million in media impact value globally.
- Influential posts (such as Cristiano Ronaldo’s Instagram share) alone contributed around US$1.4 million in media value.
Example 3: McDonald’s Hong Kong 50th Anniversary Campaign
Audience (Who?)
Targeted mainly at middle-aged Hong Kong residents who grew up with McDonald’s and have nostalgic feelings toward the brand, while also engaging younger audiences through social and game-based participation.
Message (What?)
McDonald’s placed 50 “Ronald McDonald benches” across Hong Kong and created a city-wide scavenger hunt where people could scan QR codes to collect stamps and interact with brand memories. The theme centered on “Rediscovering McDonald’s in our memories” and “Walking with the city for 50 years.”
Results (Impact)
- The campaign reportedly generated over USD 9 million in media impact value.
- Social buzz increased by 161%, with 99% of mentions being positive.
- The campaign videos (including the “Bench Placement” clip and related content) garnered over 19 million total views.
- Over 2 million Hong Kong residents participated in the scavenger hunt experience.
Read related articles:


 Top fan-driven outdoor campaigns in Hong Kong
 Why run an outdoor campaign in Hong Kong?
 Top 10 advertisements in Hong Kong
 5 Steps to launch an outdoor Campaign in Hong Kong
 How to Create An Advertising Budget? 2026 Guide, Tips, and Formulas
 Understanding YouTube Advertising Costs in 2025
 The Most Widely-Read Magazine and Newspaper in Hong Kong
 Top Social Media Platforms in Hong Kong 2025 | Usage Trends & Marketing Insights
 OOH /DOOH advertising in Hong Kong: Formats and Rates (2025 Update)
 How much does LinkedIn Advertising Cost? (2025 Update)
